How to Create a Chart/Graph - continued
Creating a Bar Graph
Let’s create a bar graph showing the average annual rainfall in four cities. We have the following information:
| City | Rainfall |
| Toronto | 750 mm |
| Vancouver | 1100 mm |
| Halifax | 1400 mm |
| Winnipeg | 500 mm |
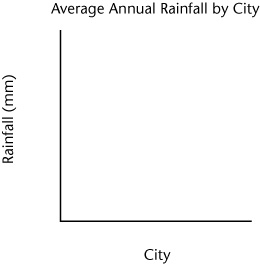
| First, let’s start with a rough drawing of a vertical and horizontal line. Technically, these are called the “horizontal axis” and the “vertical axis”. We’ll label our graph “Average Annual Rainfall by City”: |
(We could just as easily have reversed these, but it’s more conventional this way). |
 |
Note that we remembered to put the units (“mm” or millimetres) by the Rainfall label so that everyone would know exactly how much rain we’re talking about. |