
How to Create a Chart/Graph
- continued
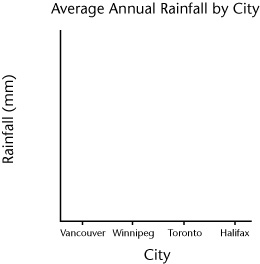
Next, we add the cities along the horizontal axis. In this case, it’s not important how we space them or the order that they’re placed. However, since we want our graph to be as easy to read as possible, we’ll space them evenly and we’ll order them from West to East (since people are used to seeing Vancouver on the left side of a map and Halifax on the right.)
 |
Now comes the most important part—creating the scale for the vertical axis. First we need to determine our maximum value. Since the largest value we have is Halifax at 1400 mm, let’s set our maximum value a little bit more than that at 1500 mm. Since we have a wide range of values (1400 mm for Halifax down to 500 mm for Winnipeg), we’ll set the minimum value at 0 mm. The final part of making our scale is to determine the number of “marks” we want on our vertical axis. (The technical word for this is “graduations”.) We want to have enough graduations that it will be easy to determine the size of each bar, but not so many that the vertical axis is overcrowded. Since we’ve set our minimum and maximum values to be 0mm and 1500 mm, let’s use seven graduations of 250 mm each: 0 mm, 250 mm, 500 mm, 750 mm, 1000 mm, 1250 mm and 1500 mm. |