Graphing—continued
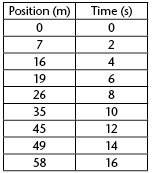
Creating a Graph From a Set of Data Once you have collected your data, you are ready to make a graph. Let’s go through the steps using an example. A jogger’s position was measured over a 16 second interval. A table of the recorded data is given here. Before starting, make sure you have enough dependent and independent values to plot. Generally you should have a minimum of five of each value.
Creating a Graph From a Set of Data
Once you have collected your data, you are ready to make a graph. Let’s go through the steps using an example.
A jogger’s position was measured over a 16 second interval. A table of the recorded data is given here.
Before starting, make sure you have enough dependent and independent values to plot. Generally you should have a minimum of five of each value.
All content copyright 2006 Province of BC