Step 4. Plotting
Now that your graph is set up, you can plot your data.
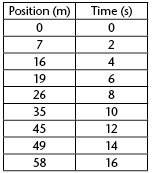
The data for the independent variable give you your x-coordinates. The data for your dependent variable give you your y-coordinates. Use a pencil to mark the points on the graph where the two values for each result meet.
Plot points on the graph using the data table.
|